Zhixing Machine
Zhixing Machine
Zhixing Machine
Designing a window and door production line requires more than arranging machines in a large workshop. A practical layout must connect product design, material flow, workforce skills, safety, and quality control. The real question is: How to design a rational production line for window and door making? This guide examines five proven approaches for building a stable and adaptable manufacturing system. It focuses on realistic factory conditions, not idealized diagrams.
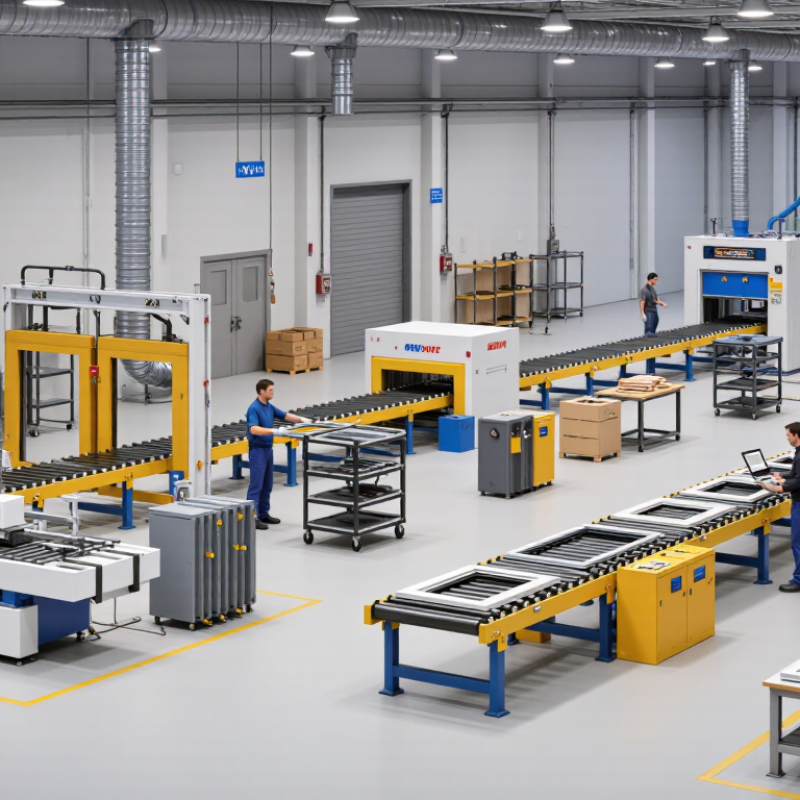
Experienced production engineers usually begin by studying product types, daily output, frame sizes, glass specifications, and available floor space. A cutting saw, corner crimper, welding machine, cleaning station, and assembly bench should follow a logical sequence. Operators should not carry heavy frames across the workshop. Shorter movement reduces handling damage and wasted time. Small details matter.
A rational line also needs buffer areas between critical processes. Without them, one machine stoppage can interrupt the entire workshop. Quality checks should appear near cutting, welding, glazing, and final packaging. Measurements, weld strength, surface finish, and hardware operation require documented inspection methods. Safety guarding, dust extraction, noise control, and emergency access must be included from the design stage. Compliance requirements vary by region, so qualified local professionals should verify the final plan.
No layout is perfect. Pilot runs may reveal crowded walkways, unnecessary handling, or unrealistic output targets. These weaknesses should be recorded and corrected before full production. The best production line remains flexible, measurable, and easy to improve as products and customer demands change.
Define Production Goals and Product Specifications
A window and door line should begin with measurable production goals. Define the daily output, product mix, frame materials, and maximum unit size. For example, a target of 1,200 uPVC frames per shift needs different equipment than 300 oversized aluminum doors. Record glass thickness, sash weight, profile depth, and hardware requirements. These details determine cutting capacity, welding accuracy, assembly space, and material flow.
Performance targets must guide the specifications. The U.S. Department of Energy reports that windows can account for up to 30% of residential heating and cooling energy use. Therefore, thermal performance cannot remain an afterthought. Set clear targets for U-value, solar heat gain, air leakage, water resistance, and sound insulation. Use recognized testing methods and keep tolerances visible at each station. A practical line should also include inspection points for corner strength, frame squareness, seal quality, and glass placement. Some plans look efficient on paper, but fail when oversized units slow every workstation.
Tips: Build a product matrix before selecting machines. Include common and unusual sizes. Measure cycle time with real profiles, not estimates. Leave space for rework and maintenance. Review the targets with operators. Their feedback may expose weak assumptions early.
| Planning Dimension | Recommended Production Definition | Typical Target or Specification | Line Design Implication | Verification Method |
|---|---|---|---|---|
| 1. Product Families | Group products by frame material and manufacturing method before selecting equipment. | Separate process routes for uPVC, aluminium, and timber products; use a shared assembly area only where tooling and quality requirements are compatible. | Install dedicated cutting, machining, welding, or corner-joining equipment for each material family to reduce changeover time and cross-contamination. | Approved product-family matrix and process-flow diagram. |
| 2. Product Size Range | Define minimum and maximum sash, frame, and glass dimensions that the line must handle. | Planning example: frame width 450–3,000 mm; frame height 450–3,000 mm; product mass and lifting limits documented separately. | Choose saw capacity, machining travel, roller-table length, glazing-table dimensions, and lifting devices according to the largest product. | First-article inspection using calibrated dimensional gauges and a signed size-capability record. |
| 3. Thermal Performance | Set thermal targets for the complete window or door, not only for the frame material. | Typical design target: whole-product U-value of approximately 0.8–1.6 W/m²·K, depending on climate, glazing, frame, spacer, and local regulations. | Provide controlled glass preparation, spacer application, sealant handling, and frame-to-glass quality checks; retain configuration data for each product type. | Calculation or laboratory test report for the complete product, supported by records for frame, glass, spacer, and sealant specifications. |
| 4. Weather and Wind Performance | Define air leakage, watertightness, and wind-load classes before finalizing joints and sealing processes. | Use project-specific performance classes under recognized standards such as EN 12207 for air permeability, EN 12208 for watertightness, and EN 12210 for wind resistance. | Control corner joints, drainage paths, gaskets, hardware installation, and sealant application; include a dedicated inspection station after assembly. | Type testing or project testing by an appropriately equipped laboratory, plus routine visual and dimensional inspections. |
| 5. Production Capacity and Takt | Convert forecast demand into a daily output, available production time, and required takt time. | Example: 80 finished units per 8-hour shift with 85% planned availability requires about 5.1 minutes of effective takt per unit. | Balance cutting, machining, assembly, glazing, hardware fitting, and packaging around the bottleneck rather than sizing every workstation equally. | Time study, hourly production board, downtime log, and monthly comparison of planned versus actual throughput. |
| 6. Material and Glass Specifications | Define profile dimensions, reinforcement, glass build-up, hardware category, gaskets, and sealants in a controlled bill of materials. | Typical insulated-glass options include double glazing around 24–32 mm overall thickness and triple glazing around 36–52 mm; exact values depend on the approved system design. | Match cutting tools, bead equipment, glazing tables, suction lifters, storage racks, and handling capacity to the heaviest approved glass unit. | Incoming-material inspection, barcode or batch traceability, thickness measurement, and bill-of-materials verification. |
| 7. Quality Control Points | Place inspection points at incoming materials, post-cutting, post-machining, frame assembly, glazing, hardware fitting, and final packing. | Record critical characteristics such as diagonal difference, frame dimensions, joint quality, drainage openings, gasket continuity, hardware function, and visible defects. | Use go/no-go gauges, calibrated measuring tools, poka-yoke fixtures, and digital work instructions at high-risk stations. | Inspection checklist, nonconformance log, corrective-action record, and periodic capability review. |
| 8. Changeover and Flexibility | Estimate the number of product variants and the frequency of size, color, glass, and hardware changes. | Set a measurable changeover objective, such as less than 20 minutes for routine tooling or program changes where product complexity permits. | Use recipe-based machine programs, quick-change tooling, modular fixtures, clearly labeled storage, and standardized setup sheets. | Changeover time study from the last good unit to the first good unit of the next product type. |
| 9. Material Flow and Safety | Define one-way movement from raw-material receiving to finished-goods dispatch while separating people, forklifts, and fragile glass. | Maintain marked aisles, stable rack loading, protected glass storage, ergonomic lifting limits, and clear emergency access routes. | Design buffer zones before bottleneck operations and use lifting aids for large or heavy frames and glass units. | Layout review, risk assessment, daily safety inspection, and monthly material-flow audit. |
| 10. Data and Traceability | Assign a production record to each order or batch containing specifications, operator checks, materials, rework, and final approval. | Minimum traceability: product code, dimensions, glass build-up, profile batch, hardware set, operator, inspection result, and dispatch date. | Use barcode labels or digital travelers at cutting, assembly, glazing, final inspection, and packaging stations. | Random traceability test from a finished unit back to its material batches and forward to its inspection records. |
Set daily output, product mix, frame materials, and maximum unit size. For example, 1,200 standard frames require different equipment than 300 oversized doors. Record glass thickness, sash weight, profile depth, and hardware needs. Small assumptions can cause major delays.
Profile dimensions influence cutting capacity, welding accuracy, and assembly space. Glass thickness affects glazing tools and handling requirements. Sash weight may require lifting support. Measure real profiles before confirming machine capacity.
Define targets for U-value, solar heat gain, air leakage, water resistance, and sound insulation. These targets affect sealing, glazing, frame design, and inspection methods. Keep tolerances visible at each workstation. Performance should not be an afterthought.
Create a mostly one-way path from receiving to storage, cutting, machining, assembly, glazing, inspection, and packing. Use floor markings and small buffer zones. Keep walking distances short. Too much inventory hides problems, while too little inventory stops production.
Inspect materials when they arrive and dimensions after cutting. Check frame squareness, corner strength, seals, glass placement, and hardware movement. Perform a final surface and packaging inspection. A loose fastener may escape a rushed check.
Separate cutting areas from assembly stations to reduce dust, noise, and accidental contact. Mark emergency exits, walking paths, and material zones clearly. Use machine guards, lockout procedures, ventilation, and suitable protective equipment. Training needs real demonstrations.
Automation can assist repetitive lifting, handling, and other stable tasks. It cannot correct a poor workflow or unclear product specifications. Stabilize the process first. Leave room for future equipment and maintenance access.
Track waiting time, rework, changeover time, and finished units per shift. Use simple production records before installing complex systems. Invite operators to review cycle times and workstation access. Their feedback may expose weak assumptions early.
Designing an efficient window and door production line begins with clearly defining production goals, product specifications, expected output, customization needs, and available resources. The next step is to map the complete workflow, from material preparation and cutting to machining, assembly, finishing, inspection, and packaging. Equipment should be arranged logically to reduce unnecessary movement, improve material flow, and support a safe, organized working environment. The question of “How to design a rational production line for window and door making” can be answered by balancing capacity, flexibility, space utilization, and long-term operating costs.
Suitable machinery, reliable materials, and digital control systems should then be selected according to product requirements and production volume. Quality control and safety procedures must be integrated into every stage, with clear inspection standards, staff training, and preventive maintenance. Finally, performance should be measured through indicators such as productivity, waste, downtime, defect rates, and delivery efficiency. Regular data analysis and continuous improvement can help the production line remain stable, adaptable, and competitive as market demands change.